(Note: this is part 2 of an article about calculating denominators. The first article is here, and a related article discusses how to assess data quality before beginning this kind of analysis.)
If a health service is used by nearly all women or children and reporting completeness is near 100%, then the number of reported events by health facilities in a year would be close to the denominator or target population for that year. In many countries, both national and subnational coverage exceeds 90% for first antenatal visit, first dose of DPT vaccine, or both, based on Demographic Health Survey (DHS) results. If the aggregated routine health system data (DHIS2) data are complete, then we only need to add the percentage of target population that has not used the services (according to the survey results) to get the target population.
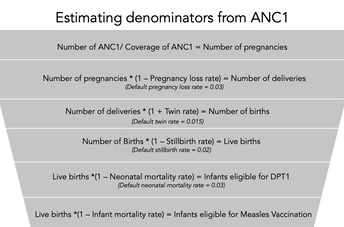
For example, if the DHS reports ANC1 coverage is 95%, and the DHIS2 system indicates that the total number of first ANC visits for the year is 100,000 ANC, this means the target population is:
100,000 / 0.95 = 105,263 pregnancies
As shown below, we can then use the number of pregnancies to estimate the number of deliveries, births, live births, and infants eligible for DPT vaccination.

Alternatively, we could use the number of DPT1 vaccinations and coverage estimates to estimate the number of infants eligible for the vaccination. Then, using the reverse process, estimate the number of live births, births, deliveries, and pregnancies.

Results are likely to differ depending on whether ANC1 or DPT1 is used as a starting point for estimating denominators. For example, the graphs below compare coverage estimates using the two estimatation methods for five indicators (BCG and measles vaccinations, second dose of malaria prevention in pregnancy [IPT2], institutional deliveries, and fourth antenatal care visit [ANC4]). Estimates are higher when ANC1 is used as a denominator, with BCG vaccination coverage exceeding 100%. These coverage estimates can also be compared to existing survey estimates to assess their accuracy.

Resources related to this article:
- Stata code
- This do-file produces a log file, Excel outputs, and graphs for national and subnational levels. Make sure to indicate your working folder, specify your country, and change default values as relevant. For the graphs, you may need to modify the labels to adapt to your specific country.
- Excel workbook
- This template is based on Niger data. It includes data sheets and analysis sheets with graphs. The analysis sheets include formulas that need to be adapted to your country’s specific information.
Additional resources are available on the health facilities data & analysis center page.
